Solar Power Prediction
About:
As renewable energy continues to grow in popularity, predicting the output of solar farms has become increasingly important. The ability to accurately forecast a solar farm’s output can help energy companies better manage their supply and demand, leading to a more efficient and reliable energy grid.
Recently, a team of myself and two other UNF students participated in a the AI for Good Hackathon, a fast-paced competition where teams of data scientists, software developers, and other experts from companies FIS and Microsoft worked with students at our university to solve a particular problem or challenge. In this case, our challenge was to create machine learning models that could predict the hourly output of a solar farm based on weather data. We focused on the eight solar farms operated by JEA, a leading utility company in the southeastern United States.
To develop our machine learning models, we used a dataset of hourly weather data from the National Oceanic and Atmospheric Administration (NOAA) for the years 2020-2022. This data included 20 different parameters, such as temperature, wind speed, and cloud cover.
We processed this data and used it to train two different types of machine learning models: XGBoost and Random Forest. XGBoost is a popular and powerful algorithm that has been used to achieve state-of-the-art performance in many machine learning competitions. Random Forest is an ensemble learning method that uses multiple decision trees to make predictions, and is known for its good performance and ability to handle large datasets.
After training our models, we tested them on a holdout dataset and were able to achieve impressive results. With Random Forest, we were able to achieve an R^2 value of up to 0.89 on the test data, indicating a strong correlation between our predictions and the actual output of the solar farms. With XGBoost, we were able to achieve an accuracy of up to 92% on the test data.
After 48 hours of intense work, we presented our results to a panel of judges consisting of professional data scientists and engineers as well as the CIO of a local AI company and were thrilled to be awarded first place out of the eight teams competing. This was a challenging but incredibly rewarding project, and we are proud of the work we accomplished.
Technologies Used:
- Jupyter Notebooks
- Python
- Pandas
- Numpy
- Matplotlib
- Seaborn
- Scikit-learn
- XGBoost
Gallery
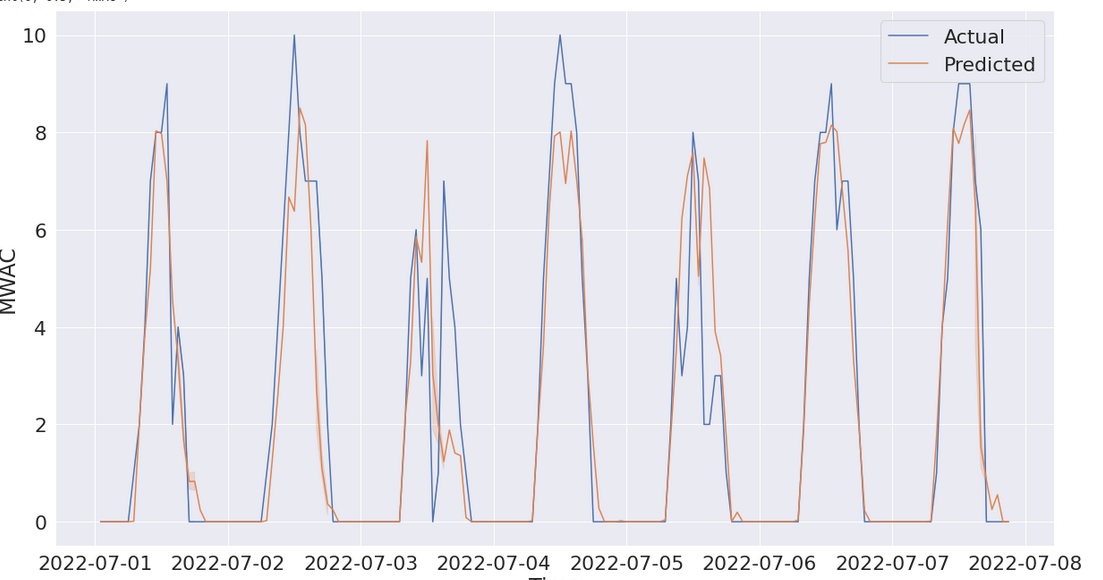
An example of the prediction made by one of our models compared to the test data:
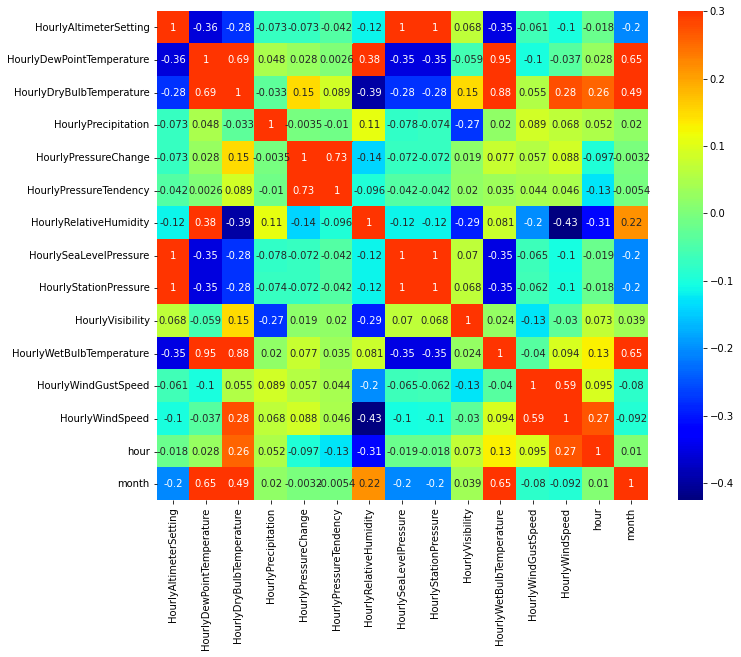
A covariance matrix of the weather variables:
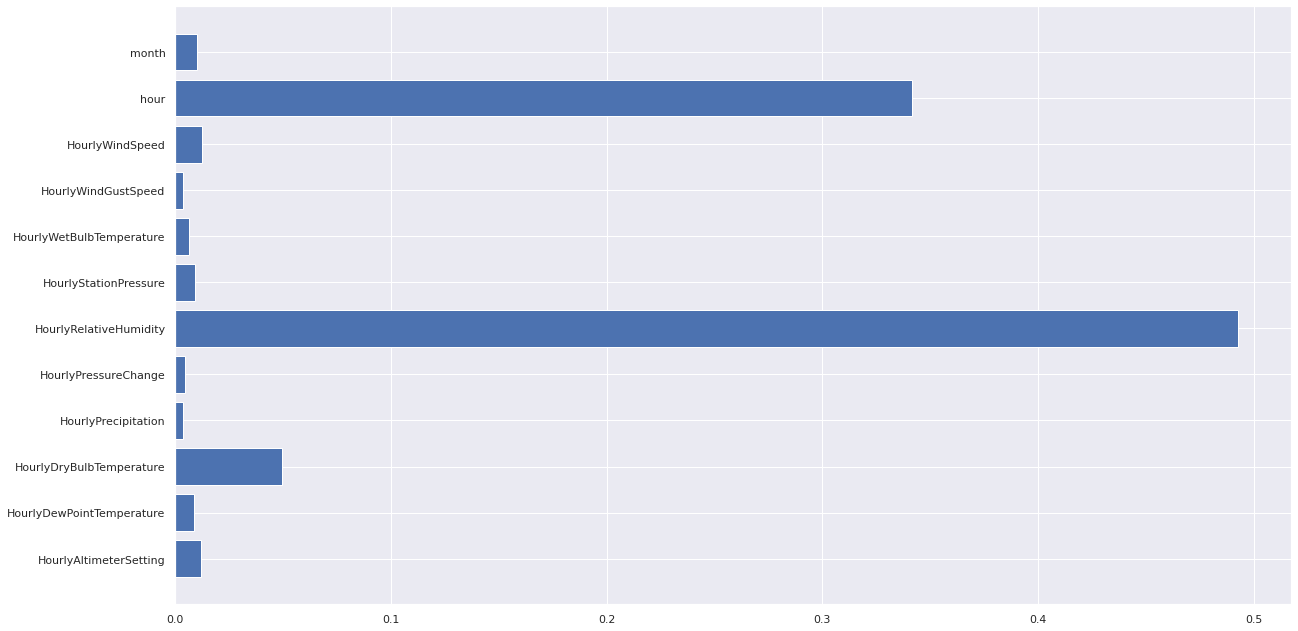
A graph demonstrating which variables had the largest effect: